Carbon is Energy – in any compound!
We should recycle and make fuel of it.
This post is one of twelve in this blog written by us at ACES – Acwareus Climate-Energy Solutions.
You’ll find links to all the others for browsing at the bottom of this page.
Our business statement of purpose is:
“
Leasing out Software for Elaborating Catalysts in producing clean cheap Fuels out of iteratively Recycled GreenHouse Gases by means of Artificial PhotoSynthesis.
”
Our blog being titled “No to Climate ignorance & insouciance, disregard & denial!“, appropriately for this post might we add also “and stupidity” — read on and it’ll make sense.
This post, as opposed to most of our other posts in this blog, forms no verbally back boned discourse other than in the adherent comments of the graphics. The back bone instead sits in our eye-opener graphics pick, their ordered sequential affinity and adherent disruptive comments. “A picture is worth a thousand words” the idiom goes, and we’re happy about that, saving us a lot of time 🙂
For current on-site information from where each image originates, click the attached link underneath. Image subtexts are (with few exceptions) entirely our own edited compilation. Any image may have a different accompanying text at its site of origin, however never essentially contradictory to our own, and our own texts are never deliberately sugarcoated or additionally sweetened to deliver an unmotivatedly modified or strengthened flavor of significance or implication — but if so, we always present information motivating any such modification to the reader. Some facts or comments may recur on multiple images, but where so in a different or complementary context.
Light-blue, underlined text inside comments (along with underneath-image sublinks) are clickable source origins or [a] mere example[s] thereof. All clickable links open up a new browser tab/window (either of, depending on Your browser settings), leaving the tab you came from open and unchanged on revisit.
OK then, Ready? – Set – Enjoy the Expertainment:
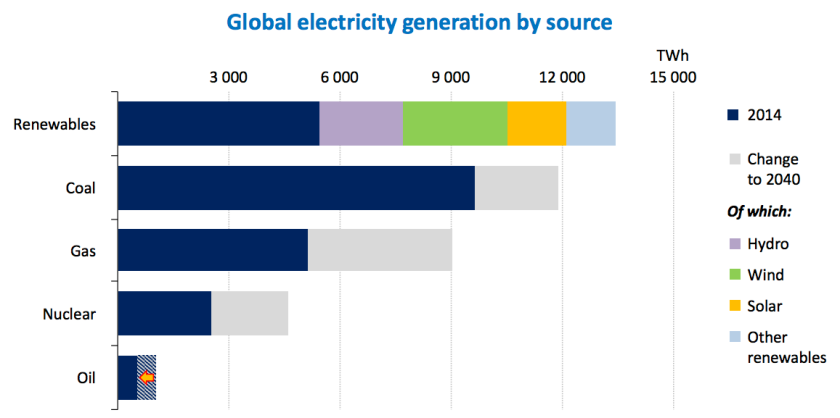
Graph 1. Historic 2014 and projected 2040 Global electricity generation by source.
Global electricity production (NB excluding heating, transport, industry etc) forecast for year 2040 compared to 2014, exhibiting that Gas based will INCREASE by 75% (5130 -> 9000 TWh) and Coal based by 23% (9630 -> 11870 TWh), whereas Oil based will DECREASE by 51% (1030 -> 500 TWh) — implying a Fossil based total INCREASE by 35% (15790 -> 21370 TWh).
http://www.resilience.org/stories/2015-11-12/analysis-iea-world-energy-outlook-sees-radical-shifts-despite-conservatism/
– comment: Renewables based electricity production (capacity!!*) in 2014 was 5430 TWh, 34% compared to Fossil (Nuclear thus unaccounted), or 22.9% of TOTAL el. prod (Nuclear accounted). Forecast for 2040 is Renewables 13430/21370 compared to Fossil = 63%, or 34.1% of TOTAL el. prod (Nuclear accounted). This may seem encouraging at first sight, even more when adding the Nuclear power non-Fossil portion (though also non-Renewable) to the comparison with Fossil, but the figures that matter to our climate and the climatic warming effects is NOT the production share of Renewables AS LONG AS SIMULTANEOUSLY the atmosphere takes in such a TREMENDOUS INCREASE of Carbondioxide CO2, plus leaked Methane CH4 and Nitrousoxide N2O, as is forecast for (the years ahead leading up to) 2040. This graph clearly exhibits that IT DOES NOT MATTER if we deploy NO MATTER HOW MUCH MORE Renewables based electricity production (plus heating and transport energy etc) on our planet as long as the consumption and hence waste gas exhausts of Fossil greenhouse gases is allowed to INCREASE WITH NO ATTENDING TO IT** whatsoever, exacerbating the Climatic Effects acutely. EVER MORE SO when taking into account the above unaccounted Carbondioxide CO2, Methane CH4 and Nitrousoxide N2O (view Graph 5 below) emissions from the [non-electricity producing] entire industry sector, 1.9 billion road vehicles (2.6 billion forecast for 2035), rail, air & marine transportation, cement manufacturing, agriculture, forestry, deforestation, cattle breeding, etc (view Graph 4 below). COMBINED!
[* Renewables’ capacity means output under the most optimal circumstances: For solar power when the sun is up and unclouded, the hours between just before noon and just after noon yielding a substantial output, other daylight hours negligible, nighttime Zero. For wind power when the wind is blowing, not too little, not too much, neither too gusty nor changing directions intermittently. Also, to sun and wind power there is the unsatisfied need for storing unconsumed energy until it is needed, i.e. until the electric grid is capable of taking in its contribution and enough consumers are capable of making use of it, AND i.e. also for feeding out power (any at all) to that grid during the long Dark/low Sunlight and Zero-Wind hours, respectively. What falls short of the requirements today is the absence or shortage of energy storage accumulators, battery packs, super-capacitors etc. Until the storage cogwheel gets fitted into the picture, these energy sources will only play a wayward role in our pursuit for a stable Renewables power supply grid!!
!! ➽ ALSO, WORTH EMPHASIZING REPEATEDLY (not least to the fan club of Renewables-of-present-state minded) are the following facts: In 2013, Renewables supplied the world with 21.7% of its electricity, according to BP. Take out hydro (water) power and they supplied the world with only 5.3% electricity. Then take out other Renewables such as biomass and geothermal and the percentage falls to 3.3% (output capacity). This negligible figure represents the implemented global solar and wind electricity production combined! And as said above, a figure even only a fraction thereof, since it furthermore represents the optimal wish-list for solar & wind capacity that would come into play only in ABSURD 24/7 cloudless-sky-sunshine AND 24/7 perfect-wind-conditions twin COINCIDENTAL scenarios. Nevertheless, these are the expectations, clad in counterfeit concealed statistics, that we’re fed to assimilate by those enriched and applauded (often low-endowed) confidence-trickster con artists (many of whom sadly are Environmental Department ministry and governmental officials, and celebrated environmentalists). People are fed the sugarcoated notion that solar and wind power and electric cars are all the tricks we need for turning the tide of aggregating atmospheric waste, and all too many swallow this rod, line and sinker (insouciant of the car’s charge electricity production type origin — probably a coal fired plant if in China, India or the US). While as a matter of fact there are hardly any more insignificant “Savers” to be found!
Q: Anybody outside the fan-club-of-present-state now who don’t comprehend that solar & wind (notably wind) are corrupt-or-ignorant politician + solar/wind industry tycoon induced initiatives (clad in “Earth Saver” mantles) that only continue to lead us astray and nowhere except ever further into a dead-end street, milking us all the money in order to expand their (TAX PAYER SUBSIDIZED) businesses, thereby financially blocking out functional and benevolent “Real Saver” ventures from staging and growing? Anybody inside the club? Maybe a few more...
Further synthesis, analysis and conclusion at Graph 3 … but don’t miss out on the [**] or Graph 2 sections in between, here below. ]
[** ATTENDING TO as in atmospheric and exhaust source waste gas capture plus recycling, preferentially into new useful Energy like with CCR – Carbon Capture and Recycling. The oil and gas companies will, hitherto as always, also future-wise continue their denial and disregard of any responsibility for the future well being or survival of mankind, animals and ecosystems on the planet we call Home — they buoyantly anticipate a firm grip on the energy market for decades ahead, implying a steeply descending road to Perdition.
➽ All the more reasons then, to go for the simple and self-evidently reasonable task of cleaning up their act (our acts) by implementing Atmospheric CleanUp Energy Regeneration technology for feeding the electricity producing power plants, industrial plants and facilities, and transportation sectors with cyclically rebred energy out of their own smokestack exhaust waste gases or captured from the atmosphere — a perpetual Combust Regenerate Energy Cycle based on Artificial Photosynthesis — regulating our climate, ocean levels, and sea & lake acidification through regulating the Carbondioxide CO2 levels. Additionally, through capturing and reusing (as is) Methane CH4 and Nitrousoxide N2O by means of today already existing (though improvable) capturing techniques.
➽ All the more reasons for supporting an effective solution through contributing to our funding campaign. ]
 Graph 2. 1900 – 2011 historic Global Carbon emissions from fossil fuels totaling all economic sectors
https://www.epa.gov/ghgemissions/global-greenhouse-gas-emissions-data
– comment: Global Carbon(dioxide) CO2 emissions from fossil fuels have steadily risen since 1900, especially since 1950. Since 1970, CO2 emissions have risen by 90%, with emissions from fossil fuel combustion & industrial processes contributing by 78% to the total greenhouse gas emissions increase 1970 – 2011. Agriculture, deforestation, and other land-use changes are 2nd largest contributors (view Graph 4 below).
The Dec 2016 level of CO2 in the atmospheric was 45% above the level when the Industrial Revolution started in 1750: 405 ppm today compared to 280 ppm in 1750. The largest national contributions to the net growth in total global emissions in 2013 were China (58% of the growth), USA (20% of the growth), India (17% of the growth), and EU28 (a decrease by 11% of the growth).
Emissions of non-CO2 greenhouse gases (all of which boasting a 23 to hundreds of times stronger climatic effect than CO2) have also increased steadily since 1900: CH4 Methane from natural gas extraction, N2O Nitrousoxide from farming, H2O water vapor from warmer sea surface evaporation. To learn more about past and projected global emissions of non-CO2 gases, view the EPA report ➽ Global Anthropogenic Non-CO2 Greenhouse Gas Emissions: 1990-2020.
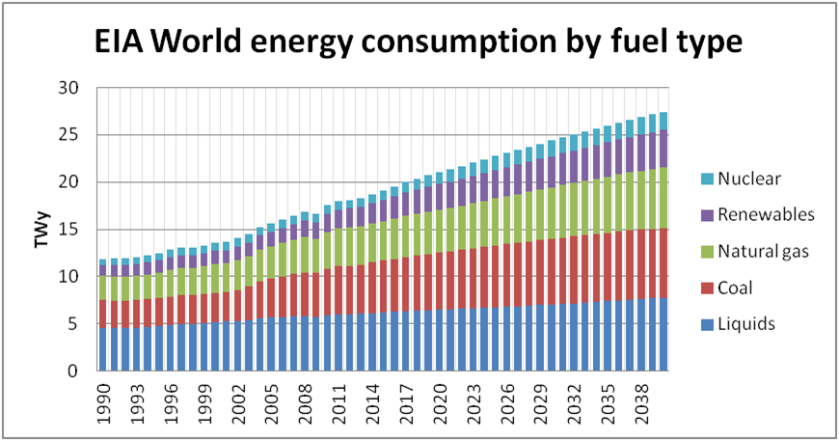 Graph 3. 1990 – 2040 historic + projected future Global Energy consumption by fuel type (NB: ‘Liquids‘ in the graph implies OIL, whereas ‘Renewables‘ include Hydro power)
http://www.stratosolar.com/2050-world-energy-sankey-diagram.html
– comment: Reconnecting to [*] under Graph 1 … (did you read sections [**] under Graph 1, and Graph 2 herein between? If not, do so.)
➽ Further Synthesis and Analysis irradiate that global Carbon(dioxide) CO2 emissions from fossil fuels will steadily keep rising also future-wise, AS LONG AS UNATTENDED — view [**] under Graph 1. Graph 3 shows that the projected rise in global energy consumption for (the years ahead leading up to) 2040 compared to 2014 is a mind-blowing 50%. Alas thereof almost exclusively fossil fuels. About Time then to turn the tide of climbing atmospheric greenhouse gas concentrations of Carbondioxide CO2, Methane CH4 and Nitrousoxide N2O, in order to meet the fossil waste gas expansions and atmospheric aggregation that will follow suit upon the increased energy consumption! View [**] under Graph 1 for fully functional action proposals.
!! ➽ All Syntheses and Analyses combined point alas to one gloomy Conclusion only:
The Economical and Political Elite likes what they see. They wish for us all to fatally stay on their treadmill all the way to Perdition, because they, as individuals, as corporations, benefit Big-Time from all fatal climatic No-Remedy Scenarios keeping them enriched from us all just trying to speed up that dysfunctional treadmill, ever faster, soon panicking — enforced by blatantly yet shamelessly dishonest but nevertheless Admitted and Politically Correct Propaganda.
➽ All that those self-sufficient, low-endowed gangsters want to do is pursue their Roadshow on their Road of Deception, and keep You, keep us all on the Road to Perdition. That’s what serves their own interests best. That’s how The Economical and Political Elite has managed for so long, and intend to pursue for as long as we allow them, to have us put our faith, engagement and TAX-PAYER EARNED MONEY into their governmentally SUBSIDIZED, between them cojoint economic ventures. A global, monumental, endless CON ACT that they as veritable criminals unabashed and unhindered get away with whilst trusted and undeservedly applauded by a faithful, ignorant, naive joint global community. Somme toute, what they do is abuse our tax money and our confidence to fill their own pockets on insincere pseudo-solutions based on archaic ideas and malfunctioning technology. And this is called Progress in Renewables “Technology”? Embarrasing, at very best. Fatal to us all, at the core of it!
Those societal parasites – sucking out not only our money, but the spirits, hopes, lives slowly out of us all by the minute, and counting – conned us all into embracing their windmills as some 21st Century Ultra-High-Tech energy science masterpiece! Jamming gearboxes, corroding fiercely both in-and outside by salty sea air, expensive to produce and install, even more so to maintain and almost impossible to repair (at sea). With a typical electrical maximum power (output capacity!!, view [*] under Graph 1) of maximum only 3-5 MW each 🙂 — Even less than ten Ferraris produce more power AT YOUR WILL, standing by 24/7 for you to turn the ignition key whenever. Even the archaic breed of farmers of this planet made much better use of their (once High-Tech) windmills during bygone times, than the HIGH-COST laughing-matters put on display today! — doing nothing but corroding, jamming, killing eagles et al., and disturbing or even hindering onshore-offshore security surveillance and air operations…
!! ➽ Face these facts — Involve, Oppose and get Active against !! Cause the “solutions” they’re feeding You, feeding us all are HOAX ALL THROUGH. Instead, run for benevolent, feasible, fully functional solutions. For saving whom and what is Dear to You and what SHOULD BE to Us All.
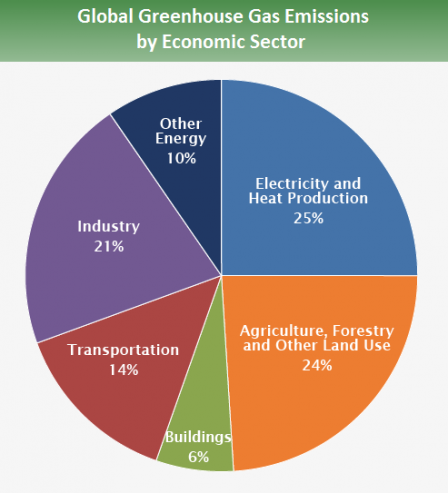
Graph 4. Global greenhouse gas (GHG) emissions by economic sector in 2010
https://www.epa.gov/ghgemissions/global-greenhouse-gas-emissions-data
– comment: surprisingly to many people, who see electric cars (together with solar and wind power, view Graph 1) as a Messiah, the entire global Transportation sector (heavy-duty lorries, trucks, buses, industrial & construction diesel machinery, cars, motorcycles, mopeds, diesel trains, marine vessels, and aircraft, all including freight, COMBINED) account for no more than 14%* (cars thereof less than half, i.e. roughly 7% of total global Carbondioxide CO2 emissions)! [* In the US alone, almost 30%. ]
This graph also discloses the utopia — the complete impracticability and uselessness of trying to capture CO2 or other GHG emissions at their source: even if we’d hypothetically succeed in the Mt Everest-size effort of trapping ALL CO2 emissions from big- & small-scale electricity production, 75% of the GHGs plus all related non-CO2 emissions would still elude; even when including ALL (millions upon millions of) big- & small-scale industry CO2 emissions sources, 54% would elude. With every other economic sector increasing their emissions year by year. Enough to drown the world before we’d see it coming, due to points-of-no-return passed and violent threshold effects — e.g. gigantic coastal Antarctic glacier fringes breaking off and crushing the surrounding marine ice shelves* with sea-elevating consequences as well as the additional effect of destabilizing the support for coast-near as well as country-sized inland glaciers from sliding out into the ocean, inducing tsunamis manifolds higher than ever seen before. [* Ice shelves are vast expanses of ice floating on the sea, several hundred metres thick, at the edge of glaciers. ]
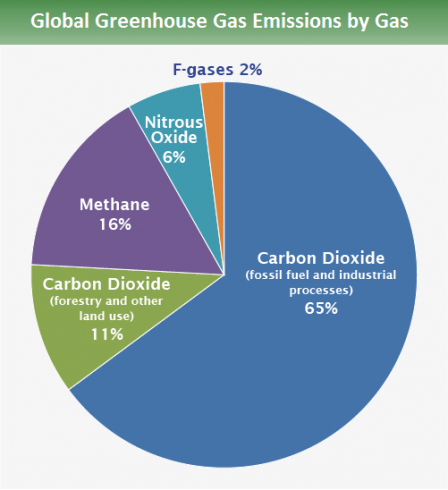
Graph 5. Global greenhouse gas (GHG) emissions by type of Gas in 2015
https://www.epa.gov/ghgemissions/global-greenhouse-gas-emissions-data
– comment: Methane CH4 currently accounts for 16% of total GHGs emitted, but CH4 is a 23 times more aggressive climate warming effective gas than Carbondioxide CO2! Hence, multiplying 16% by 23 giving 3.68 proves that 2015 emissions of CH4 have a 3.68 times more detrimentally climatic impact than CO2! This is a fast growing issue for the world, since fracking (hydraulic fracturing/ shale gas drilling) for natural gas (predominantly CH4) and [more uncommonly] oil extraction mainly in the USA (but also in 16 other countries) leaks Methane CH4 into the atmosphere from drill holes during extraction but also after the companies have left extraction sites poorly caulked after themselves.
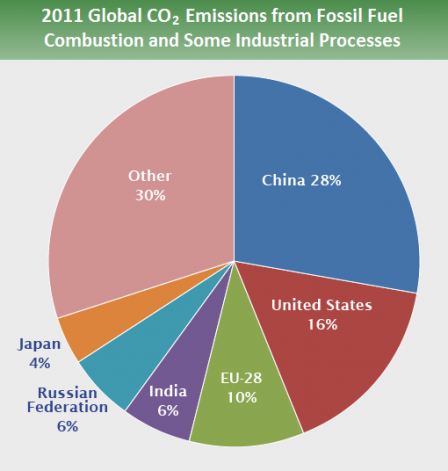
Graph 6. Global Carbondioxide CO2 emissions by country of origin in 2011
https://www.epa.gov/ghgemissions/global-greenhouse-gas-emissions-data
– comment: Since 2011 China has speeded up their emissions of CO2, partly due to a stark accretion of cars and other road transports, but overwhelmingly more due to inaugurating new Coal fired power plants (roughly one per week!) to the point that Chinese electricity production power (effect) from Coal alone 2015 was in no less than 1100 GW, whereas comparatively US Coal power was 350 GW.
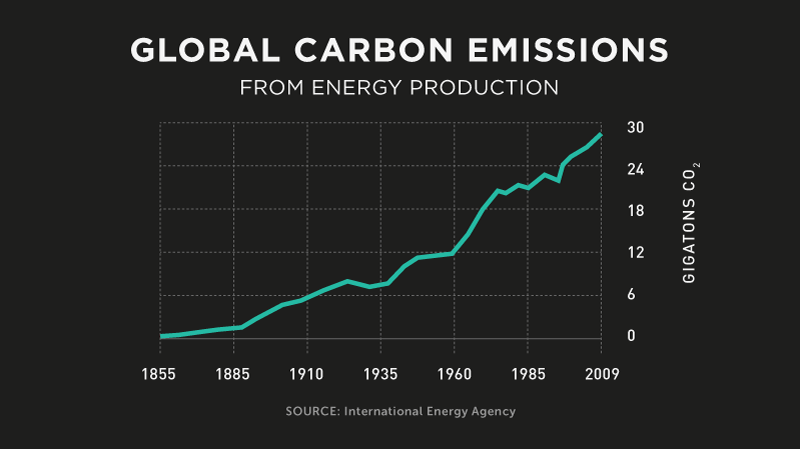
Graph 7. 1855 – 2009 Global Carbon(dioxide) CO2 emissions from energy production (omitting heating, transports, industry, cement manufacturing, farming, forestry etc)
https://www.gatesnotes.com/Energy/Energy-Miracle
– comment: China has since the mid-00’s overtaken the pole position of global Carbon(dioxide) CO2 emitters — Chinese electricity production power (effect) from Coal alone was in 2015 no less than 1100 GW, whereas US Coal power was just 350 GW. The development during our present decade is no less discouraging…
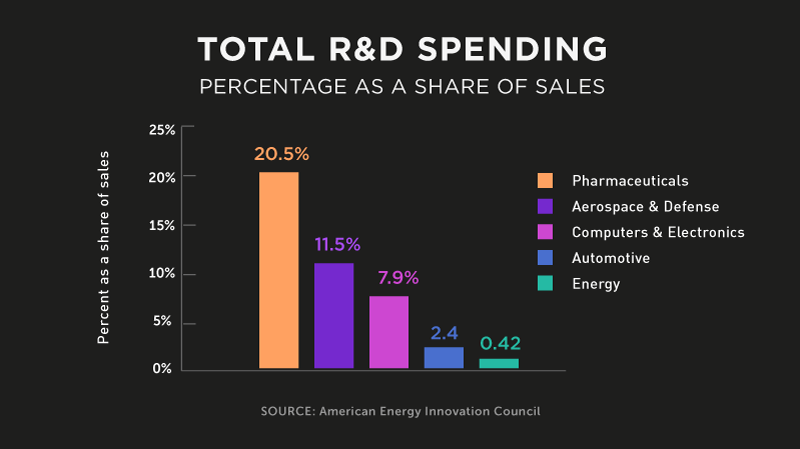
Graph 8. 2012 US total R&D spending percentage as a share of sales
https://www.gatesnotes.com/Energy/Energy-Miracle
– comment: the United States is severely under-investing in Clean Energy R&D (Research & Development)! Ludicrous and shocking to all those unaware — “what do they expect”??

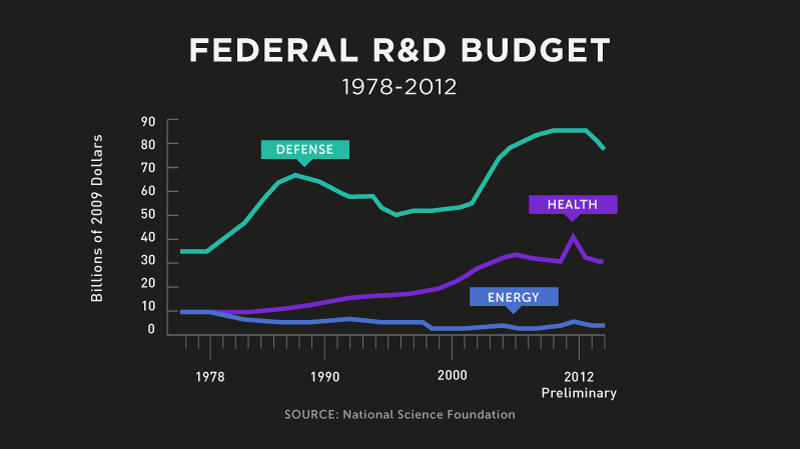
Graph 9. 1975 – 2012 US federal R&D budgets for energy, defense and health
https://www.gatesnotes.com/Energy/Energy-Miracle
– comment: no comments necessary… 😯
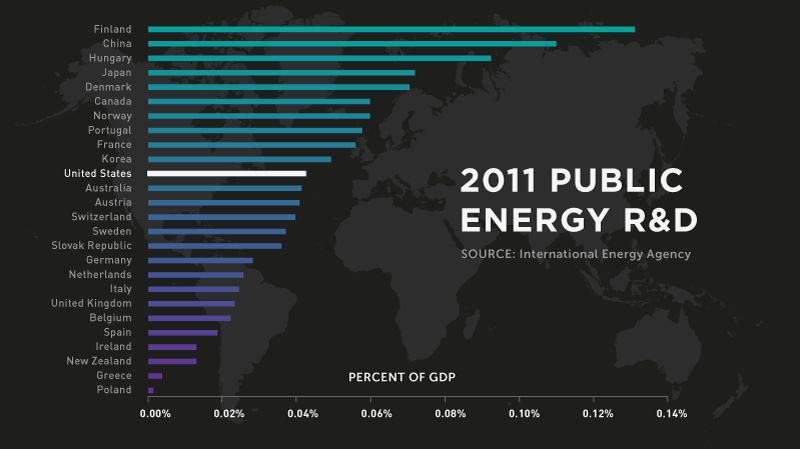
Graph 10. 2011 Global public energy R&D spendings country-wise
https://www.gatesnotes.com/Energy/Energy-Miracle
– comment: China inaugurates a new Coal-fired power plant each week (only, a month into 2017 however announcing a time-out in new deployments). From that perspective, their public energy R&D spendings are shameful (0.11% of GDP) — not least since their net detrimental climatic impact is top of the league. Finnland, a poorer Nordic country, on the other hand impresses [relatively] much (0.13% of GDP still isn’t exactly skyrocketing, but stands out in the pitiful competition). Let’s hope the industrialized countries of the world all very soon make amends — a multiplying factor 10 to 100 (Oh Yes!) times today’s readings would be urgently needed, no doubt. Poland (by far lowest, hardly measurable R&D spendings) are huge emitters of Coal power CO2 emissions (and of industrial waste and feces polluted rivers running out into the Baltic Sea), but as always park their heads in the sand and leave it to the rest of us to clean up their dirty act. New Zealand, once a proud stronghold of Greenpeace and other environmentalist minded people, today disappoint the world by negligible 0.01% energy R&D spendings of their GDP and an also otherwise blatant prioritizing of a raw-capitalistic economic growth. So sad to see shortsighted egoism and irresponsible climatic disregard gradually take over more and more in so many countries (ref also to Graph 9: US Energy R&D Spendings up to 1978 and Decline since, and to Graph 8: 2012 US Energy R&D Budget).
B E C A U S E
 Photo: alohaspirit/iStock
W E ‘ R E L I A B L E T O
C L E A N I N G U P O U R A C T
 Photo by Kim Semg (CC BY-NC-ND 2.0)
Carbon is Energy – in any compound!
We should recycle and make fuel of it

“If you get up in the morning and think the future is going to be better, it is a bright day. Otherwise, it’s not.” – Elon Musk (PayPal, SpaceX, Tesla, Hyperloop, SolarCity, & OpenAI)
– – – – – – – – – – – – – – – – – – – – – – – – – – – – – – – –
Writing in The Baffler, Laurie Penny explores what it will mean for the civilization to collapse slowly, because of climate change, rather than in a single nuclear bang:
” For anyone who grew up in the Cold War, the apocalypse was a simple yes-no question: either it was coming, or it wasn’t. Many people I know who grew up before the end of the nuclear arms race describe this as oddly freeing: there was the sense that since the future might explode at any point, it was not worth the effort of planning. Climate change is species collapse by a thousand cuts. There will be no definitive moment we can say that yes, today we are fucked, and yesterday we were unfucked. Instead the fuckery increases incrementally year on year, until this is the way the world ends: not with a bang, not with a bonfire, but with the slow and savage confiscation of every little thing that made you human, starting with hope. “
. . .
We wish for the world to move away from a global Elite driven systemic Energy – Climate paradigm:

… to merely a less organized bunch of (black-suite) anti-heros:
… to even less… … to just “That One…” … to just this one?


…No, to None! – this one burying its head in the sand is a myth, as You know?
No animal is that stupid, nor could it be – unless counting our own species in …

… … … ?!

Here are all our posts in this blog:
Water. and Air. – – – – – – – – (2016 Nov 27)
Facts. non-Alternative. – – – – – (2017 Feb 20)
News. Terrifying. – – – – – – – (2017 Mar 29)
Zero options? Never. – – – – – – (2016 Dec 05)
Scenarios. and Implications. – – – – (2017 Jan 02)
Gates Notes. on Climate-Energy. – – (2017 Jan 24)
Answers. to Questions. – – – – – (2016 Dec 14)
Testimonials. of Progress. – – – – (2017 Jul 21)
CCR – APS processes – – – – – – (2016 Dec 14)
APS/e3 concept outlines – – – – – (2016 Dec 14)
CatELab-APS/e3 research software – – (2016 Dec 14)
CatELab & APS/e3 integrated processes – (2016 Dec 14)
Here is our corporate website & our funding campaign:
Acwareus Climate-Energy Solutions – official website
Our [imminent] funding campaign (draft)


6 thoughts on “Facts. non-Alternative.”